
How to Look Up Marin County Jail Population Data
Two official sources carry the numbers. The Marin County Sheriff posts a snapshot of bookings and average daily population on its custody page. The state Board of State and Community Corrections runs the Jail Profile Survey, which collects monthly and quarterly data from every county jail in California. For national context, the federal Bureau of Justice Statistics publishes jail reports across the country.
The state survey is the best place for current capacity and trend data.
The official statewide source is the BSCC Jail Profile Survey, which posts county-level figures.
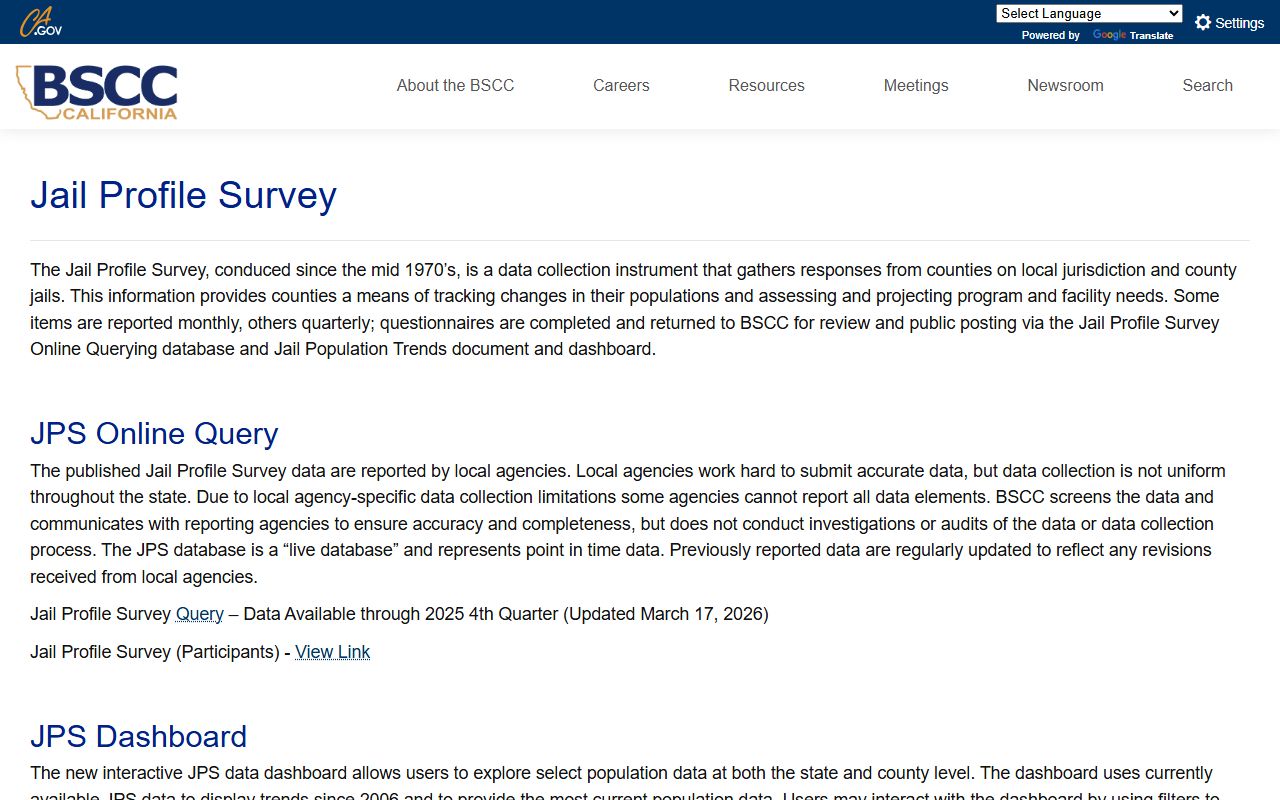
The survey reports data through late 2025 and warns that local agencies submit the figures and may revise them, so treat any single month as provisional.
The survey is built to be read, not just stored. It offers a query tool and a dashboard with filters for county, gender, and custody status. That lets you pull Marin on its own or set it beside other counties. When you read a value, note whether it is an average daily population, an end-of-month count, or a quarterly snapshot, because those are not the same measure and should not be charted together.
Marin County Jail Capacity Overview
The county runs one jail. It sits at 13 Peter Behr Drive on the Civic Center grounds, completed in 1994 and built underground into the hillside, with a tunnel that moves people into the court areas. The facility holds men and women booked or sentenced by Marin courts, plus short-term holds for people who are in transit to another jail or prison.
The official county history explains how the jail was designed to fit the Frank Lloyd Wright Civic Center.
That design story is told on the county's Civic Center history page.

Rated capacity is worth a careful word. Older references to the Marin jail's bed count vary, and a single web snippet is not a reliable figure to publish. The BSCC keeps a rated-capacity dataset that is the proper source, so any capacity claim should be pulled from that spreadsheet rather than from memory or a secondhand number. Capacity and population are also different ideas: capacity is how many beds exist, while population is how many are filled on a given day.
| Facility | Address | Function | 2022 Average Daily Population |
|---|---|---|---|
| Marin County Jail | 13 Peter Behr Drive, San Rafael, CA 94903 | County jail for booked and sentenced people; short-term holds | 245 per the Sheriff |
Average Daily Population and Bookings
The clearest Marin snapshot comes from the Sheriff's 2022 figures. That year the jail booked 5,454 individuals and held an average daily population of 245. Those two numbers measure different things. The booking count is the total number of intakes across the whole year. The average daily population is how many people were in the jail on a typical day.
Mixing the two leads to bad conclusions. A jail can book thousands of people a year while holding a couple hundred at any moment, because most bookings are short. Many people are released within hours or days on bail, citation, or a quick court date. The daily count stays far below the yearly intake for exactly that reason.
The picture grows when you add supervision. The Sheriff has reported more than 258 sentenced individuals on county parole or work release at the same time. Those people are serving a sentence in the community, not inside the jail, so they do not show up in the average daily population. Counting them with in-jail residents would overstate how many people the facility actually holds.
Demographic Context for Marin County
Jail population data is easier to read next to the county's overall size. The U.S. Census Bureau estimated Marin County's population at about 253,694 as of July 2025. Set against a daily jail population in the low hundreds, that shows the jail holds a very small share of county residents on any given day.
For a breakdown by gender and custody status, the BSCC dashboard is the tool, since it filters county data those ways.
County population context comes from the U.S. Census QuickFacts for Marin County.
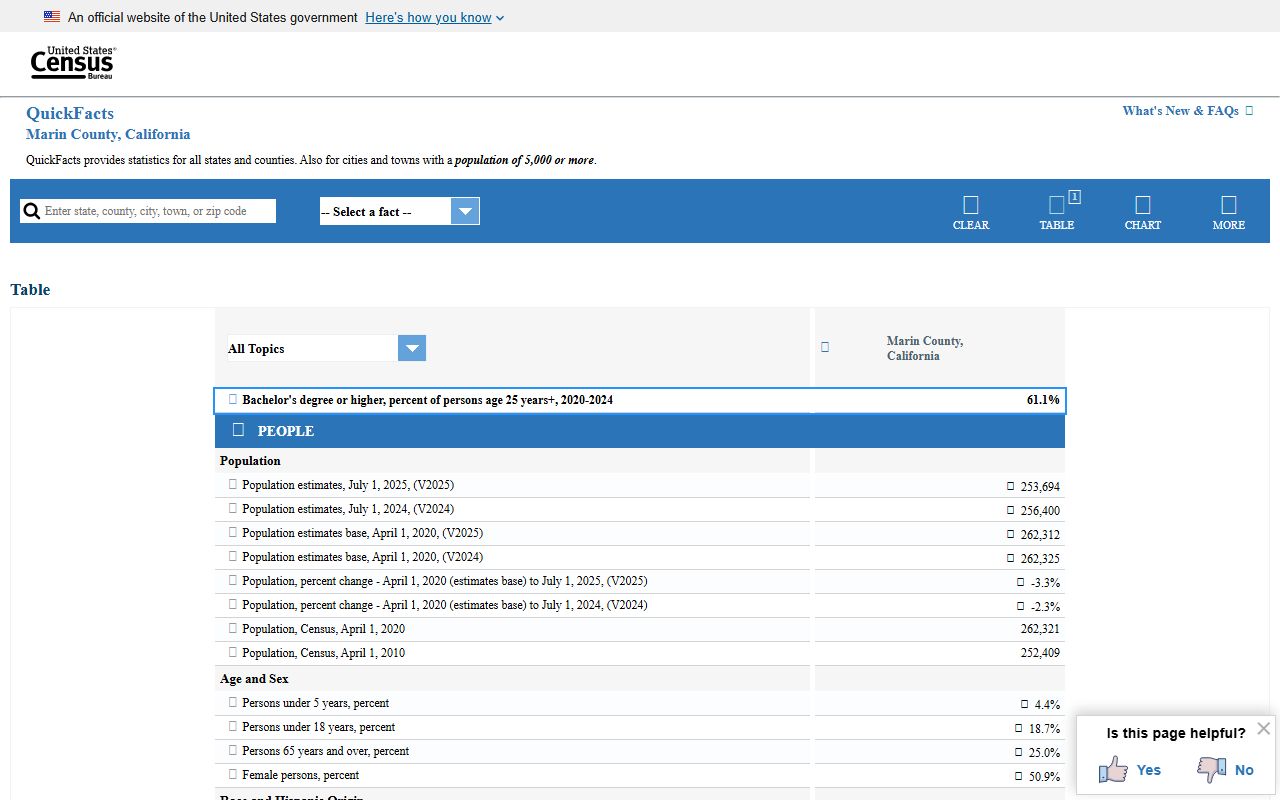
The Census figures are county-wide, not jail-specific, so use them as a backdrop rather than a jail demographic.
Pretrial vs Sentenced Population
A jail population splits into two broad groups, and the difference matters for policy and for reading the data. Pretrial people are held while their case is pending and have not been convicted. Sentenced people are serving a jail term after a conviction. The BSCC survey tracks this split, listed as sentenced and non-sentenced.
| Pretrial (Non-Sentenced) | Sentenced | |
|---|---|---|
| Status | Case pending, not convicted | Convicted and serving a term |
| Why held | Bail not posted or no-bail order | Court sentence to county jail |
| Data source | BSCC non-sentenced count | BSCC sentenced count |
Marin also manages many sentenced people outside the jail through county parole and work release, which keeps the in-jail sentenced count lower than the total number of sentenced individuals.
Misdemeanor and Felony Population
The jail holds people across charge levels. Some are booked on misdemeanors, some on felonies, and some on infractions that carry a custody issue like a warrant. Felony cases tend to stay longer because the stakes and the process are larger, while many misdemeanor bookings clear quickly.
The exact felony and misdemeanor split for Marin is not broken out in the Sheriff's public snapshot. For a current breakdown, the BSCC survey and the Sheriff are the sources to ask, rather than a third-party estimate.
Mental Health and Medical Population
Some people in custody have serious mental health or medical needs, and the court system has dedicated tracks for them. Marin runs mental health and LPS conservatorship calendars in the Superior Court, and the jail provides care under state standards. Records tied to mental health and medical status are confidential, so they do not appear in any public population count.
Prisoner Services can help arrange a visit for an inmate with mental illness, and a medical or psychological concern is routed to the housing sergeant rather than a public line. Those supports sit outside the population totals but shape how the jail manages its population.
National and State Context
A single county number means more when you compare it. The BSCC tracks every California county jail, so Marin can be placed next to the statewide picture. The federal Bureau of Justice Statistics does the same job at the national level. Rather than one fixed rate, think in terms of which source measures what.
| Level | Source | What It Measures |
|---|---|---|
| County | Marin Sheriff and BSCC | Local bookings, daily population, and capacity |
| State | BSCC Jail Profile Survey | All California county jails, with trends |
| National | Bureau of Justice Statistics | Jail population rates across the country |
Comparing Marin's daily population against its roughly 253,694 residents gives a rough sense of scale, but the BSCC and BJS rate methods are the right tools for an apples-to-apples comparison.
Population Trends Over Time
A trend line needs more than one year. The Sheriff's 2022 snapshot is a useful baseline, but a real trend uses the BSCC survey, which carries monthly and quarterly data. To build a defensible five-year view, pull the same measure for each year, such as the annual average daily population, and label it clearly so you do not compare a monthly count to a yearly intake.
State and county jail numbers shifted in recent years for reasons that include bail policy, court backlogs, and alternatives to custody. Because the BSCC data can be revised after first posting, treat the latest quarter as provisional and confirm older figures against the current spreadsheet.
A careful trend also separates the moving parts. A rise in bookings does not always mean a higher daily population, since short stays can climb while the average holds steady. A drop in the daily count can reflect more work release rather than fewer cases. Reading the survey with that in mind keeps a five-year chart honest instead of alarming.
Searching for Marin County Inmate Records by Name
This page is about totals, not people. To look up a specific person in custody, the population data is the wrong tool. Use the Sheriff's booking log for an individual search. Details and the search fields are on the Marin County inmate records page, and release tracking is covered on the released inmates page.
Where the Data Comes From
Two official hands touch these numbers. The Marin County Sheriff reports its own bookings and average daily population. The BSCC collects standardized data from the Sheriff and every other county, which makes its survey the source for comparisons and trends. For anything beyond a snapshot, the BSCC survey is the authoritative record.
Because the data flows from the local agency up to the state, small differences can appear between a Sheriff figure and a BSCC figure for the same period. That is normal. The Sheriff's page is a quick local snapshot, while the BSCC standardizes the count so every county is measured the same way. When the two differ, the BSCC method is the one to use for any comparison across counties or years.
Note: A yearly booking total and an average daily population are different measures, so never read 5,454 bookings as the number of people in the jail at once.